Virtual SAN Storage performance tests in action
Virtual SAN provides the Storage Performance Proactive Tests which lets you to check parameters of your environment in an easy way. You just need few clicks to run a test.
Well, we can see a lot of tests from nested labs in the Internet, however there are not so many real examples.
I decided to share some results of such a real environment which consists 5 ESXi hosts. Each is equipped with 1x SSD Disk 1,92 TB and 5x HDD 4 TB.
It’s almost 10% of space reserved for cache on SSD. VMware claims that the minimum is 10% so it shouldn’t be so bad.
Since Virtual SAN 6.2 released with vSphere 6.0 Update 2, VMware makes the testing of performance much more easy. That’s possible thanks to Storage Performance Proactive Tests which lets you to check parameters of your environment in an easy way. They are available from Web Client, you just need few clicks to run a test. Perhaps those aren’t the most sophisticated whilst they are really easy to use.
To start some tests, simply move to Monitor>Virtual SAN>Proactive Tests tab on VSAN cluster level and click at run test button (green triangle).
As you quickly realise there are few kind of tests:
- Stress Test
- Low Stress test
- Basic Sainity Test, focus on Flash cache layer
- Performance characterization – 100% Read, optimal RC usage
- Performance characterization – 100% Write, optimal WB usage
- Performance characterization – 100% Read, optimal RC usage after warm-up
- Performance characterization – 70/30 read/write mix, realistic, optimal flash cache usage
- Performance characterization – 70/30 read/write mix, realistic, High I/O Size, optimal flash cache usage
- Performance characterization – 100% read, Low RC hit rate / All-Flash Demo
- Performance characterization – 100% streaming reads
- Performance characterization – 100% streaming writes
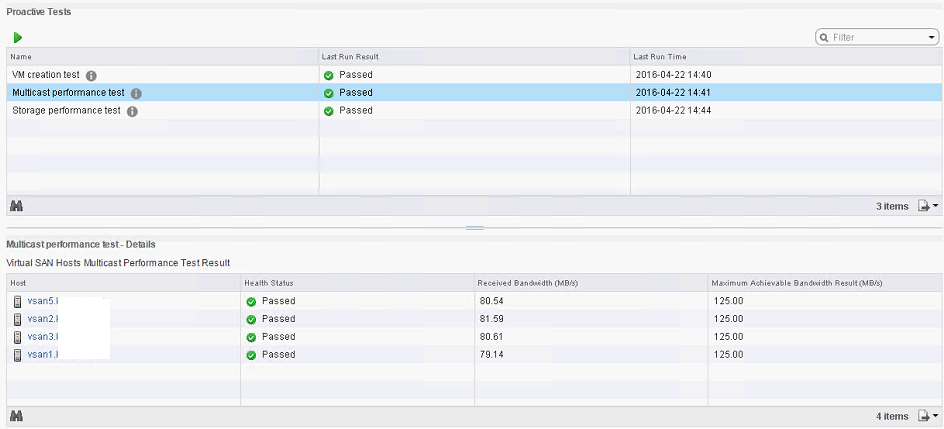
Let’s start from a multicast performance test of our network. In case the received bandwidth is below 75 MB/s the rest would fail.
Caution!!! VMware doesn’t recommend using this tests on production environments especially during business hours.
Test number 1 – Low stress test, the duration set to 5 minutes.
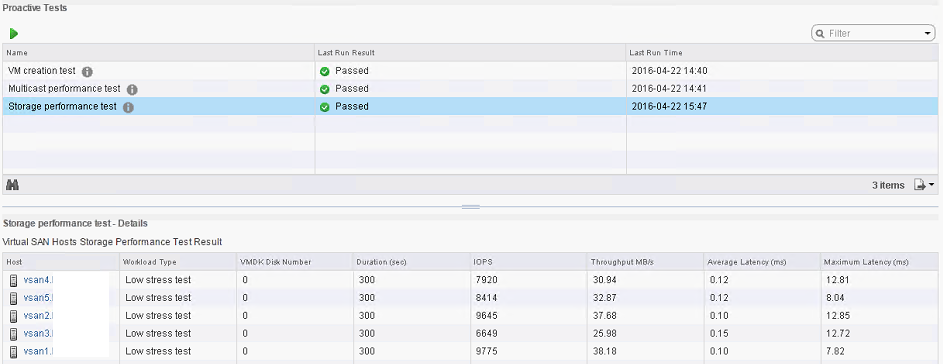
As we can see the IOPS counts around 40K for my cluster of five hosts. The average throughput around 30 MB/s, gives ca. 155 MB/s total.
Test number 2 – Stress test, duration set to 5 minutes.
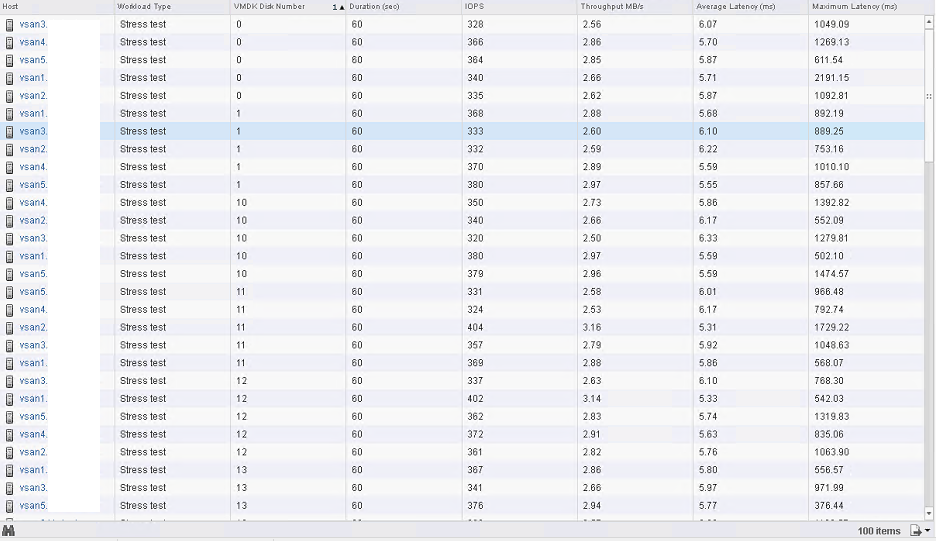
Here we can see that my VSAN reached about 37K of IOPS and almost 260 MB /s of throughput.
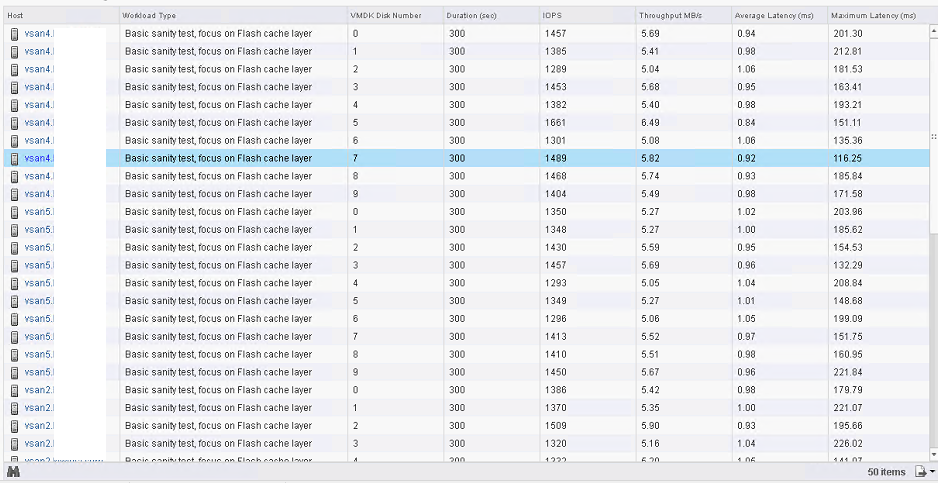
Test number 3 – Basic Sanity test, focus on Flash cache layer, duration set to 5 minutes
Test number 4 – 100% read, optimal RC usage, duration set to 5 minutes.
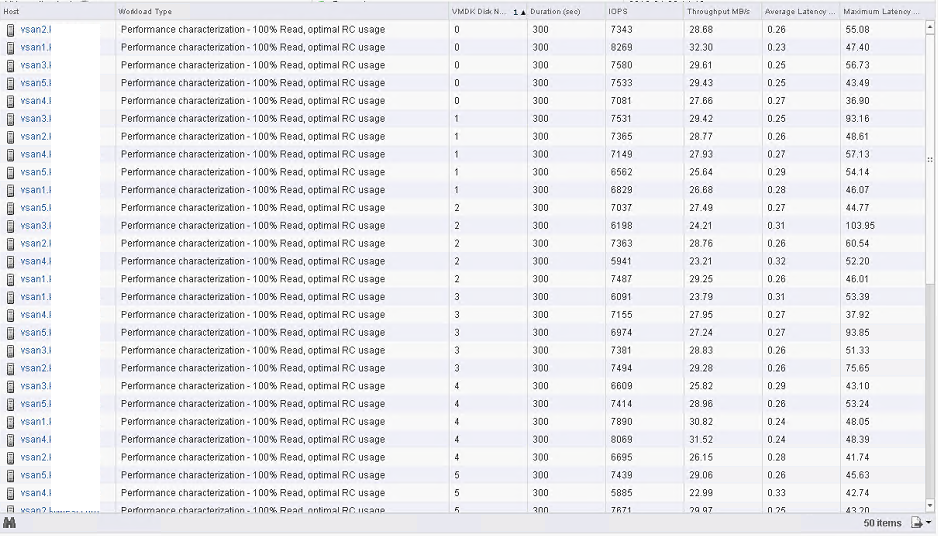
Here we can see how does the SSD performs while most of the reads
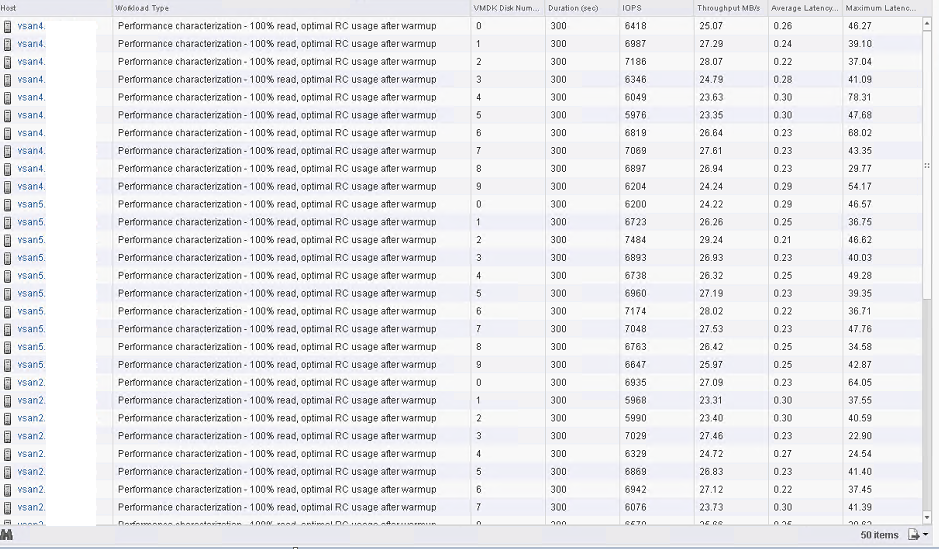
Test number 5 – 100% read, optimal RC usage after warm-up
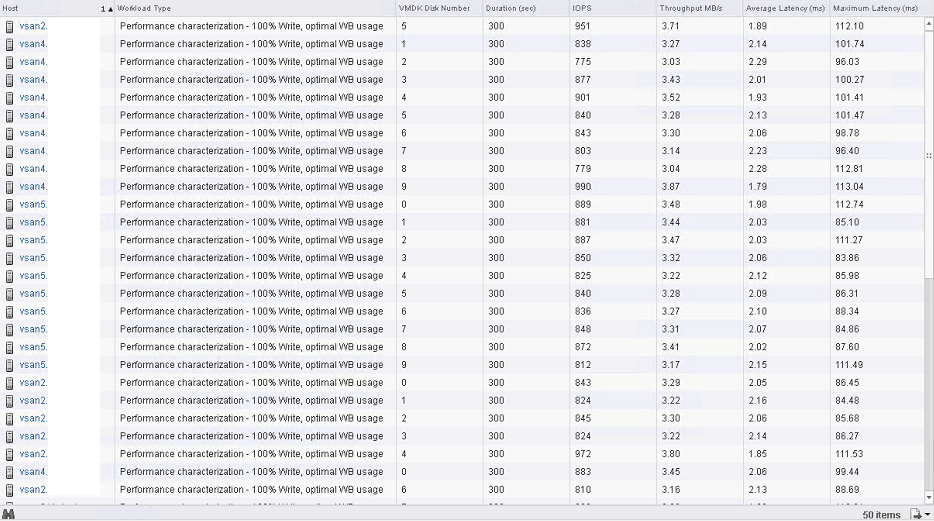
Test number 6 – 100 % write, optimal WB usage
If you have any other real results of your VSAN I’d be glad to see it and compare different configurations.