How to monitor virtual network – story about netflow in vSphere environment.
Before we start talking about NetFlow configuration on VMware vSphere let’s back to basics and review protocol itself. NetFlow was originally developed by Cisco and has become a reasonably standard mechanism to perform network analysis. NetFlow collect network traffic statistics on designated interfaces. Commonly used in the physical world to help gain visibility into traffic and understanding just who is sending what and to where.
NetFlow comes in a variety of versions, from v1 to v10. VMware uses the IPFIX version
of NetFlow, which is version 10. Each NetFlow monitoring environment need to have exporter ( device carrying netflow flow’s) , collector (main component ) and of course some network to monitor and analyze 😉
Below You can see basic environment diagram:
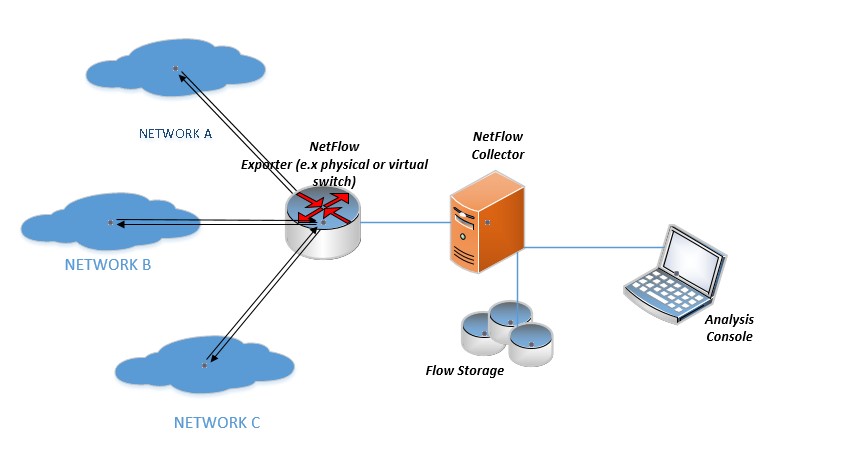
We can describe flow as tcp/ip packets sequence (without direction) that have common:
- Input interface
- Source IP
- Destination IP
- TCP/IP Protocol
- Source Port (TCP/UDP)
- Destination Port (TCP/UDP)
- ToS IP
Note. vSphere 5.0 uses NetFlow version 5, while vSphere 5.1 and beyond uses IPFIX (version 10).
Ok, we know that distributed virtual is needed to configure NetFlow on vSphere but what about main component NetFlow collector – as usual we have couple options that we can simply divide in commercial software with fancy graphical interfaces and open source staff for admins that still like old good cli 😉
Below I will show simple implementation steps describing examples from both approach :
Manage engine NetFlow analyzer v12.2, more about software on https://www.manageengine.com/products/netflow/?gclid=CP3HlJbyv9ACFSQz0wod_UcDCw my lab VM setup:
- Guest OS:Windows 2008R2
- 4GB RAM
- 2vCPU
- 60 GB HDD
- vNIC interface connected to ESXi management network
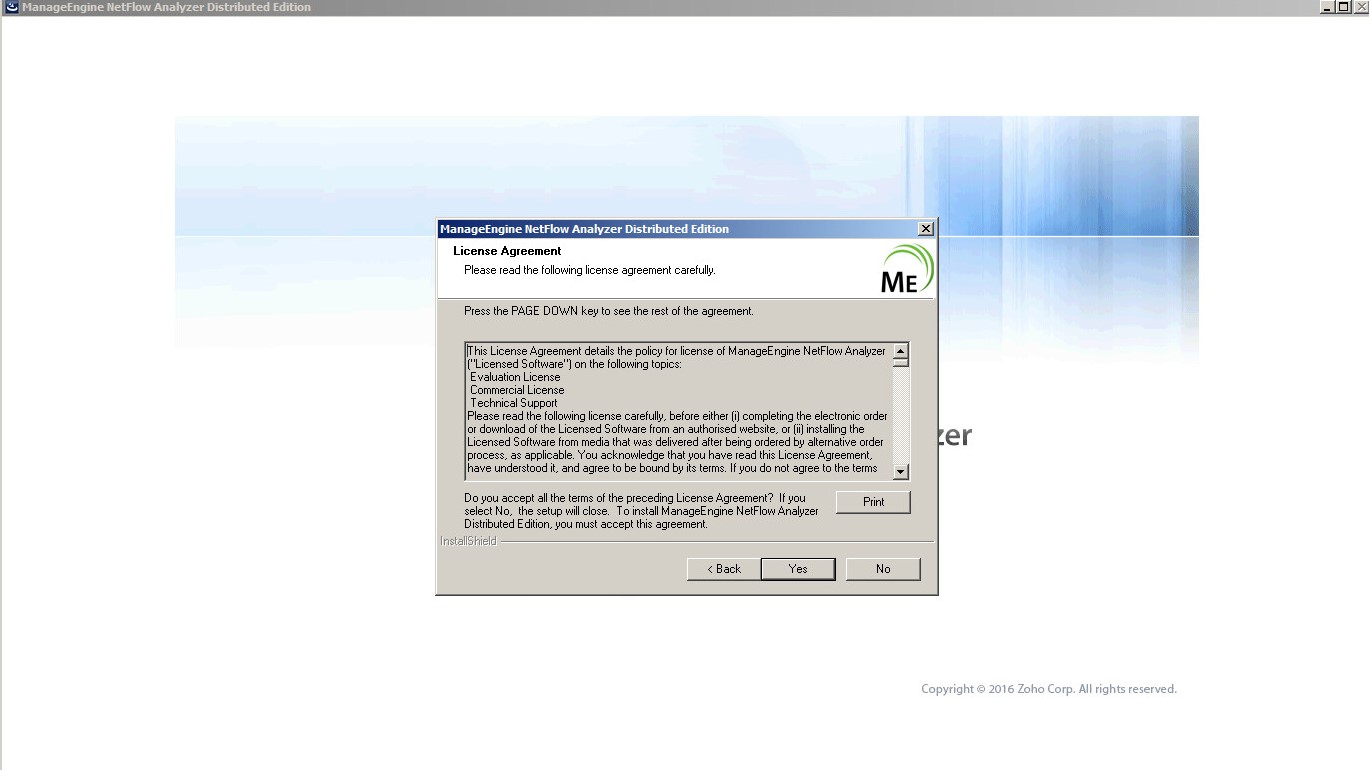
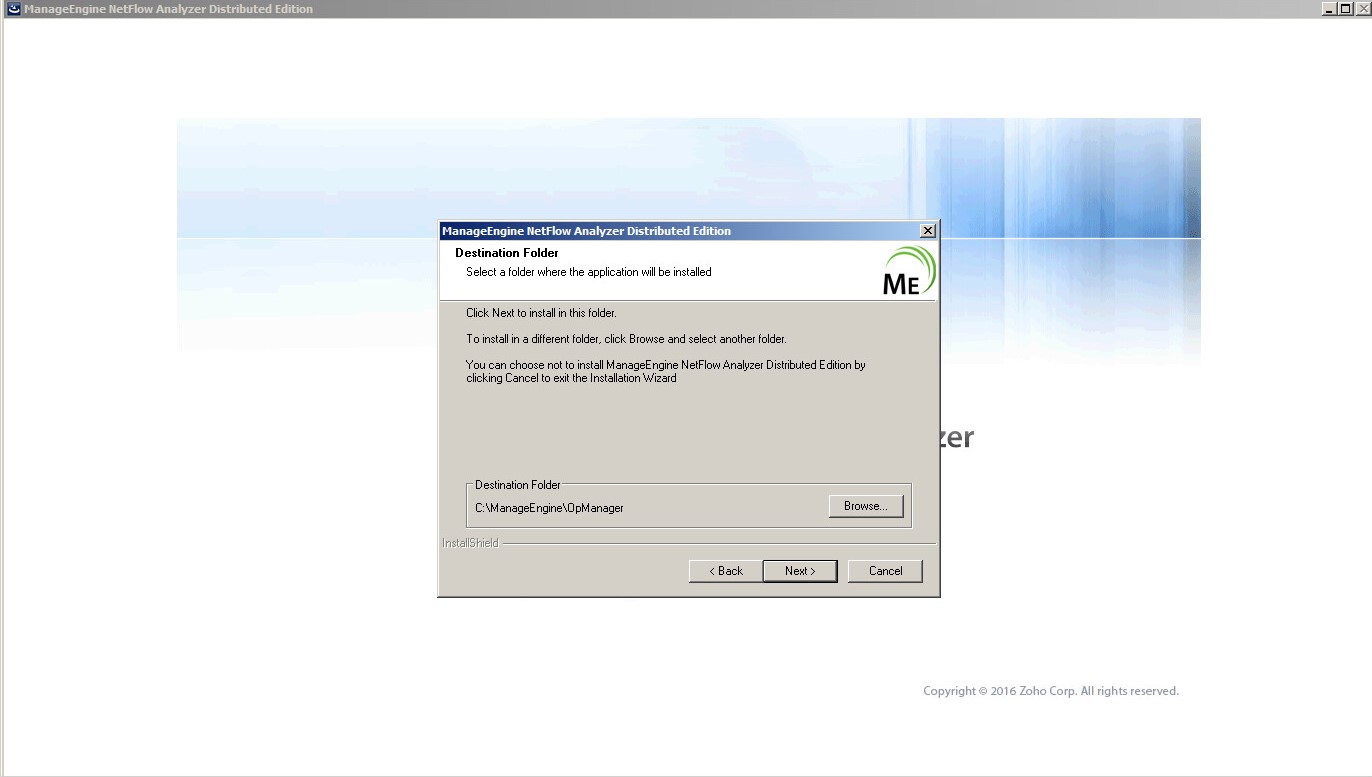
Installation (using embedded database just for demo purpose) is really simple and straight forward. Let’s start from starting the installer:

- accept license agreements
- choose installation folder on vm hdd
- choose installation component option – for this demo purpose we go with simple environment with only one collector server, central reporting is not necessary

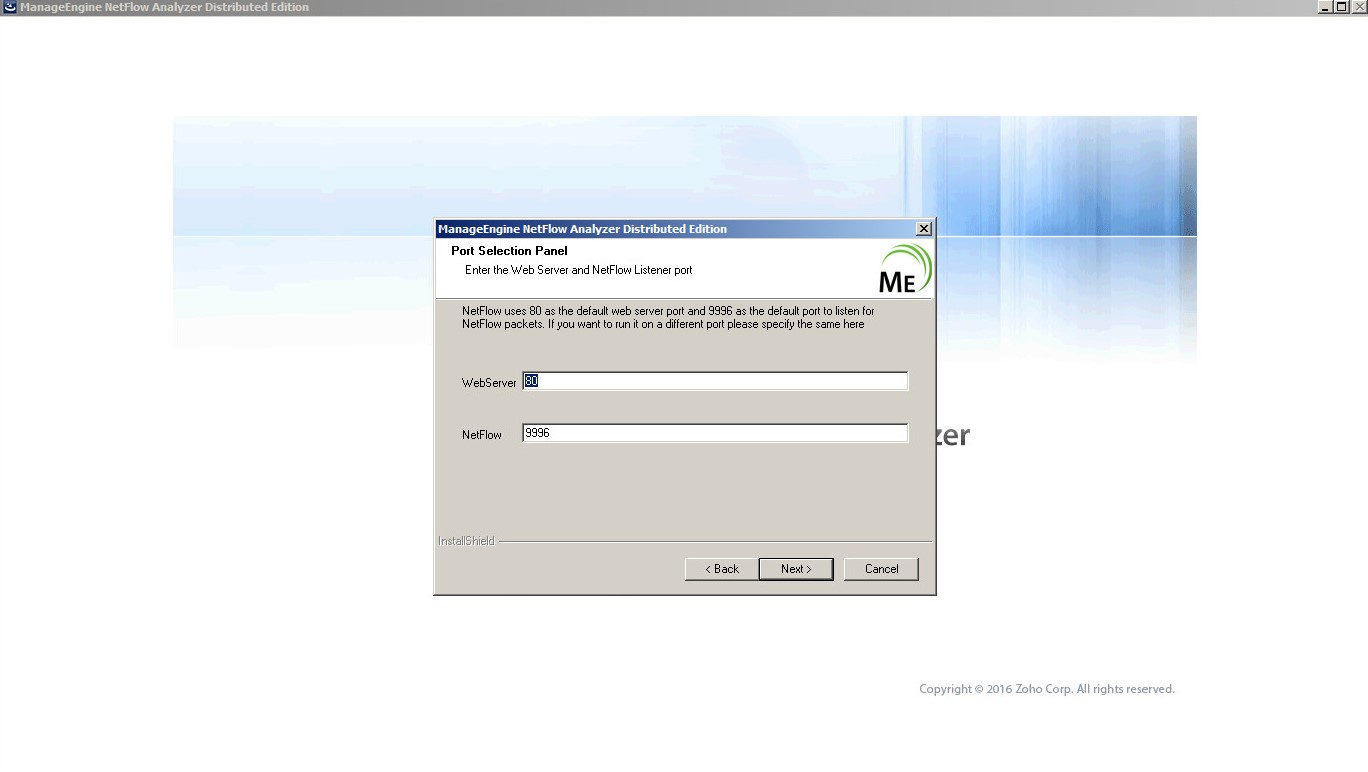
- choose web server and collector services TCP/IP ports
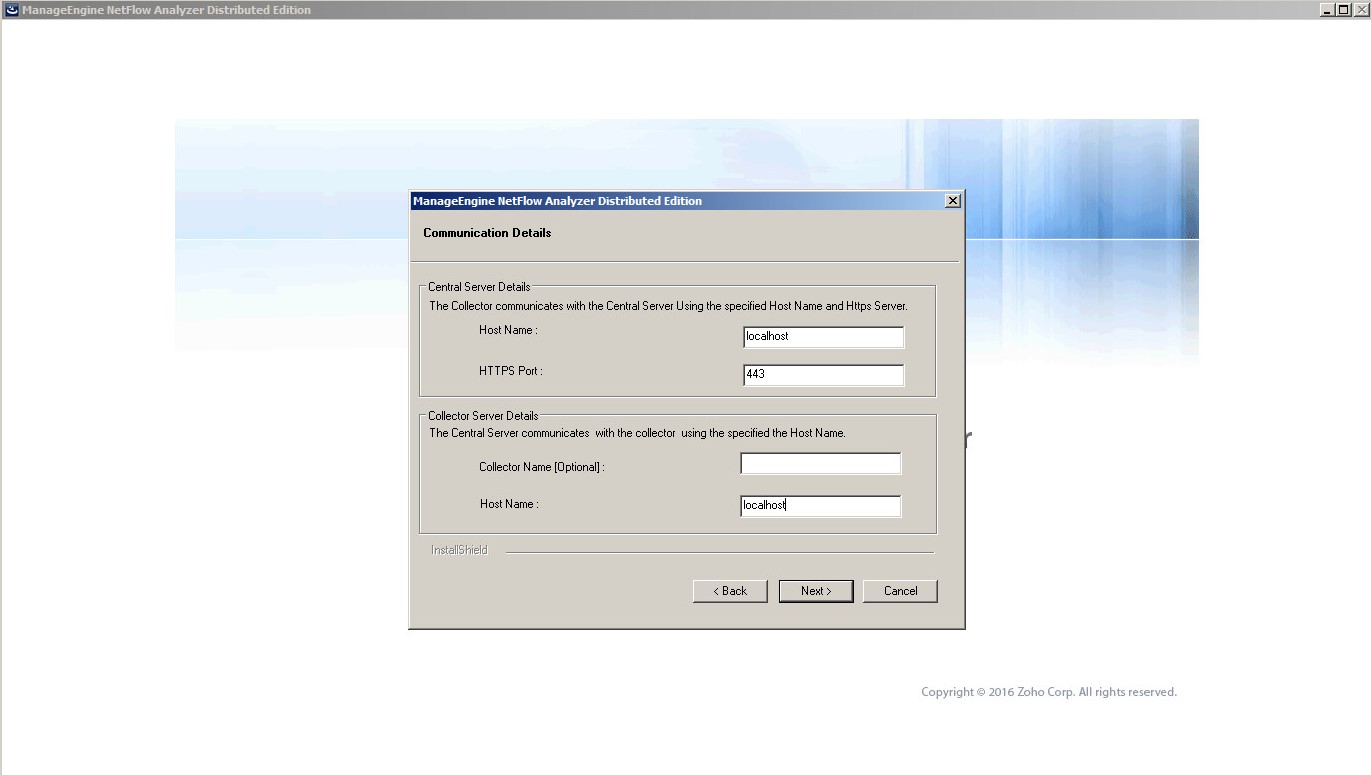
- provide communication details – again in this demo we have all components on one server and we can simply go with localhost
- optional – configuration proxy server details

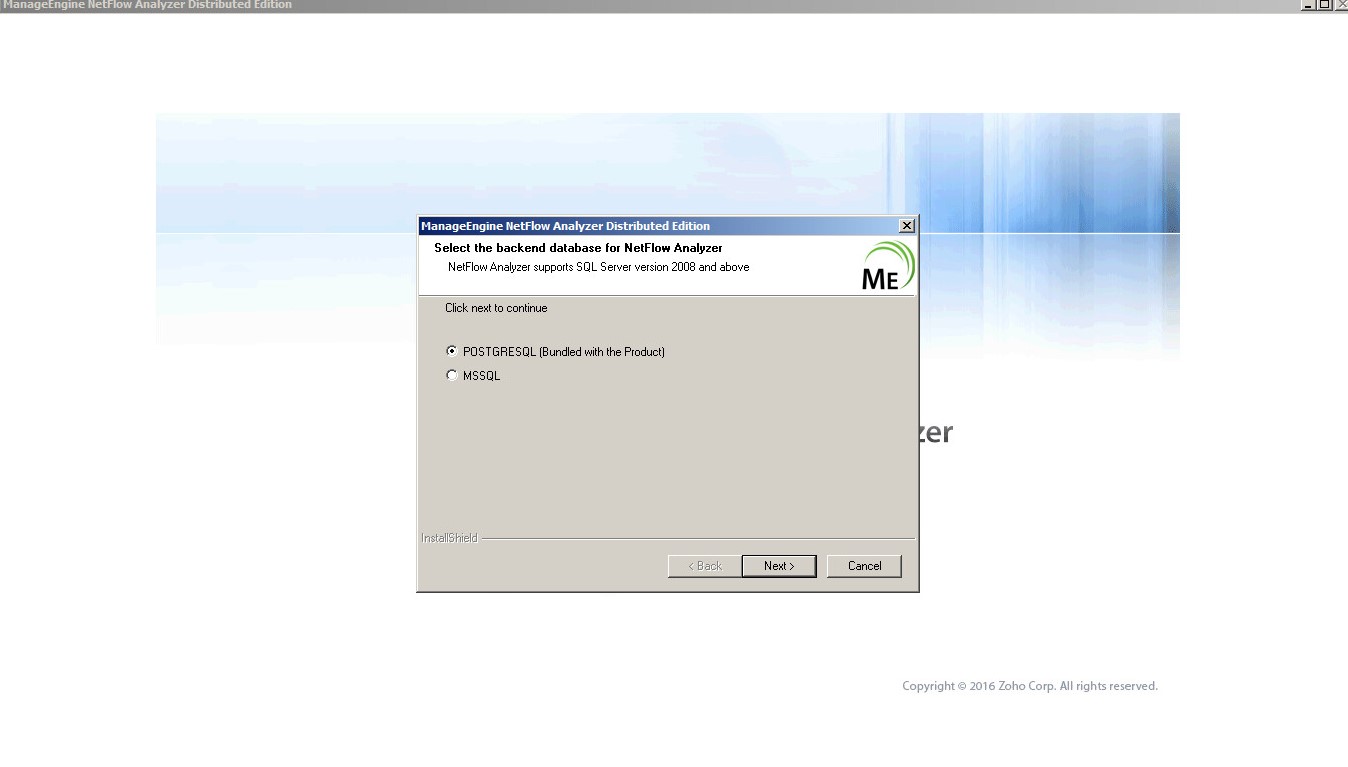
- select database – on this demo i used embedded Postgresql , but if You choose MS database remember about ODBC config.
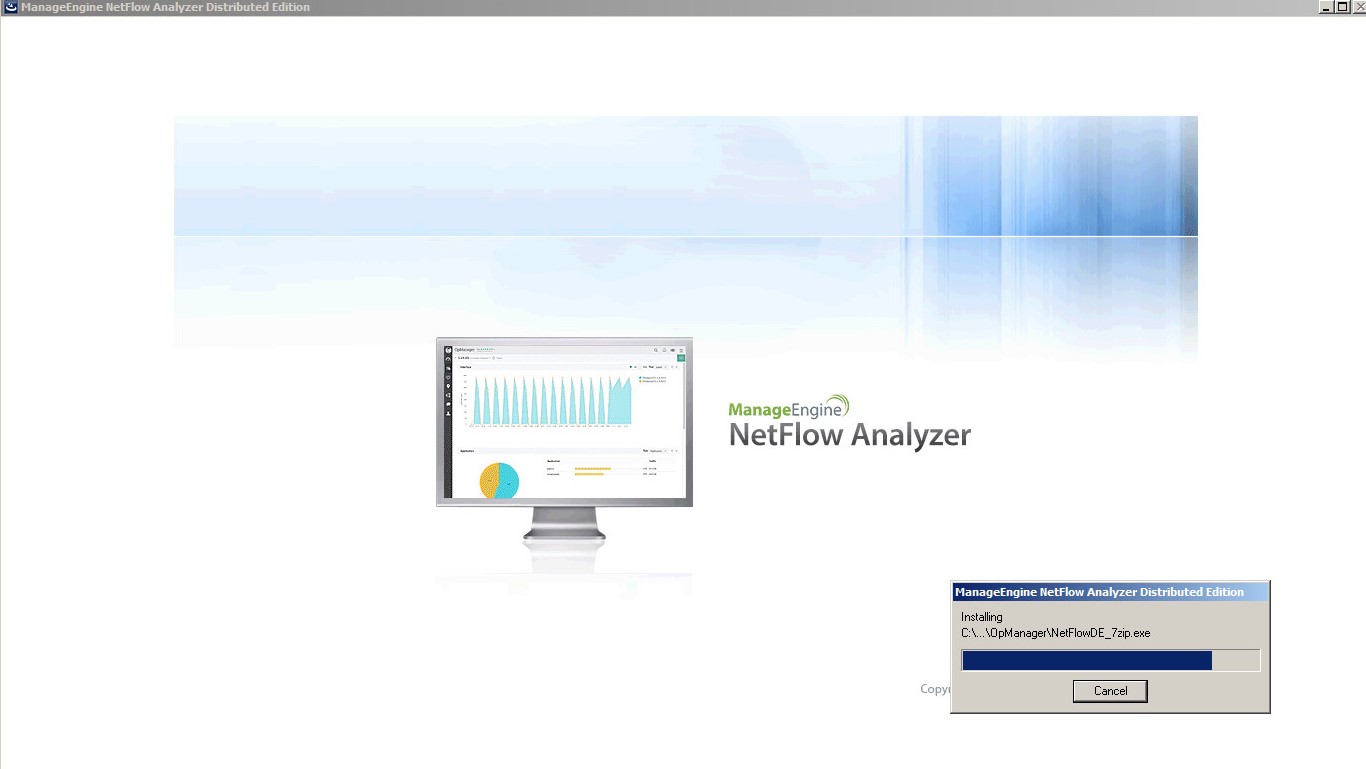
- installation is quite fast – couple more minutes and solution will be ready and available to start work:
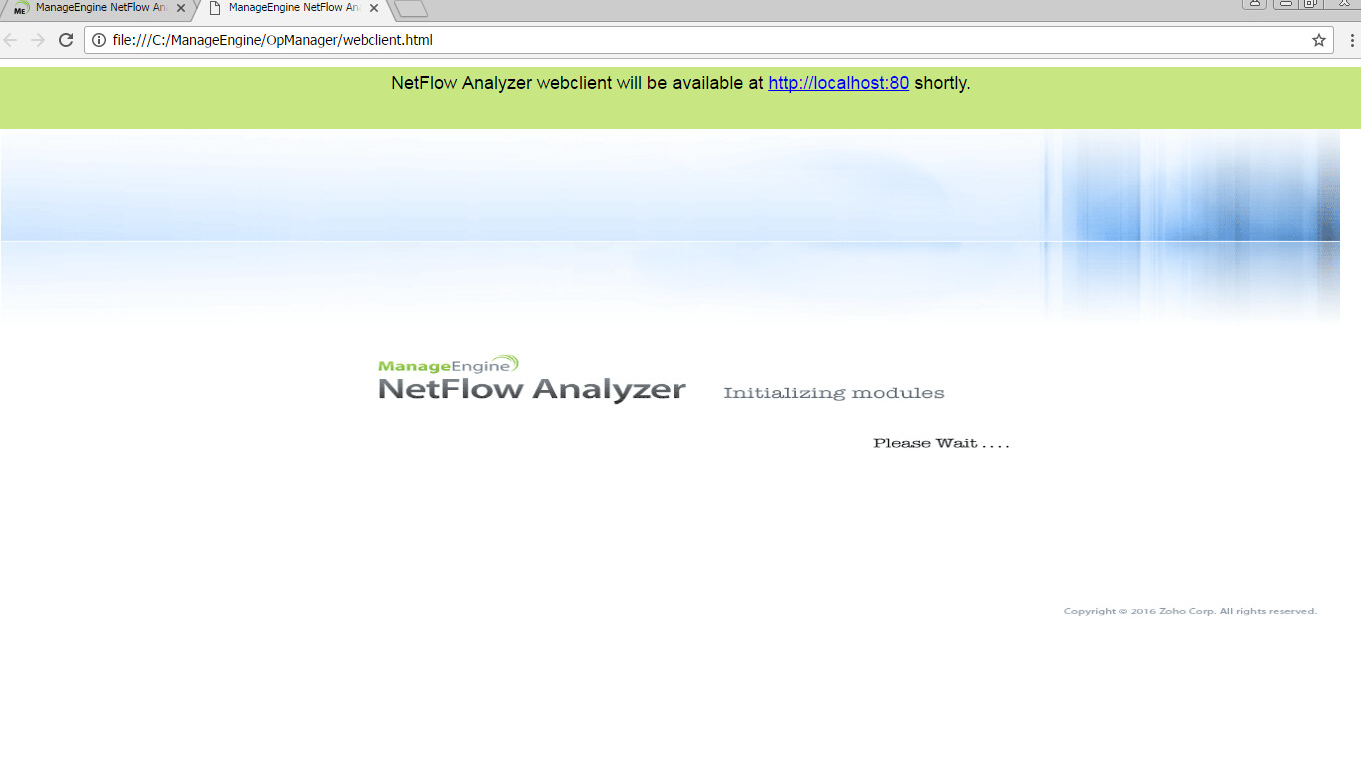
… Web client like in VMware need couple CPU cycles to start 😉
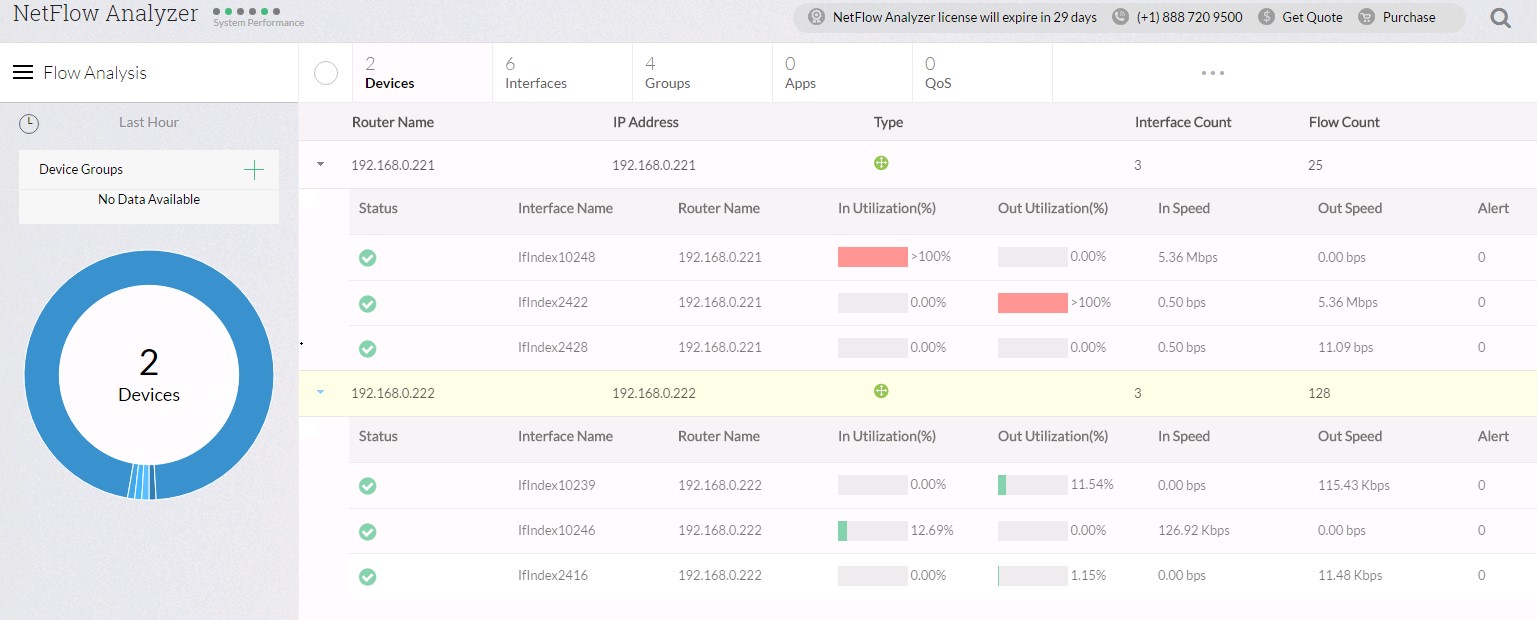
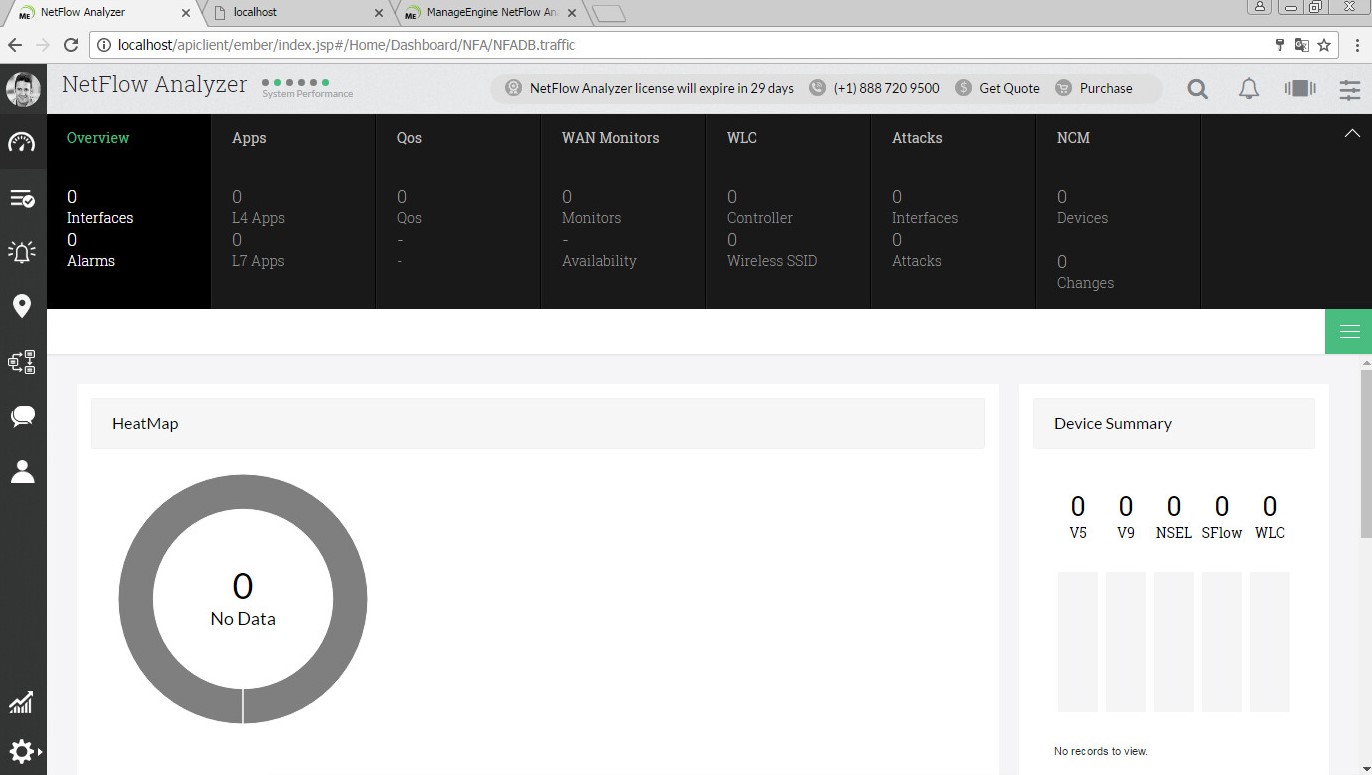
.. and finally we can see fancy ManageEngine NetFlow collector
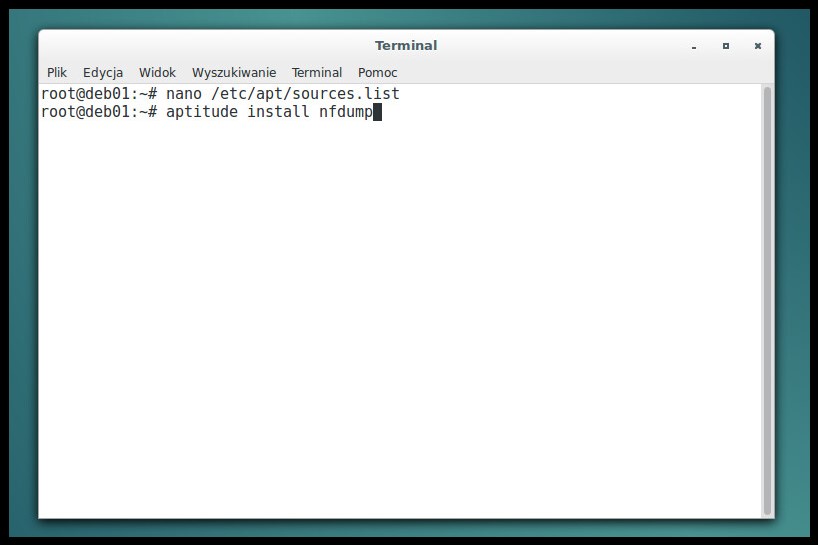
II) Open-Source netdump tool – nfdump is distributed under the BSD license, and can be downloaded at: http://sourceforge.net/projects/nfdump/ my lab VM steup:
- GOS: Debian 8.6
- 4GB RAM
- 2vCPU
- 60 HDD
- vNIC interface connected to ESXi management network
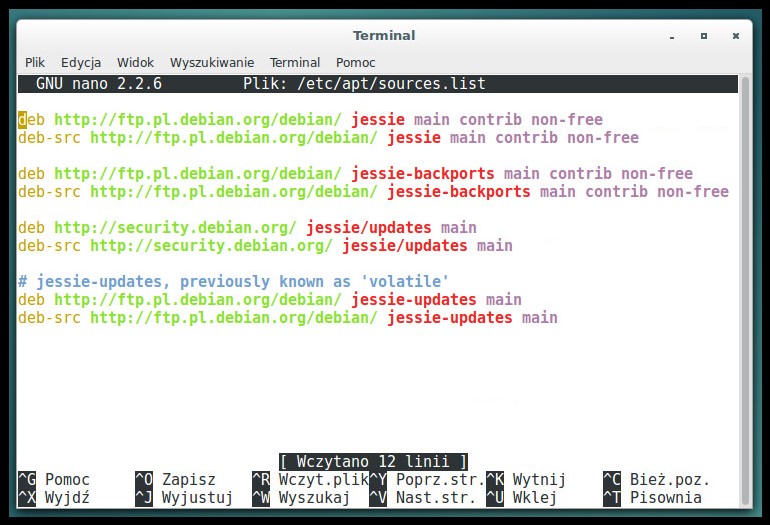
- We need to start from adding some sources to our debian distribution:
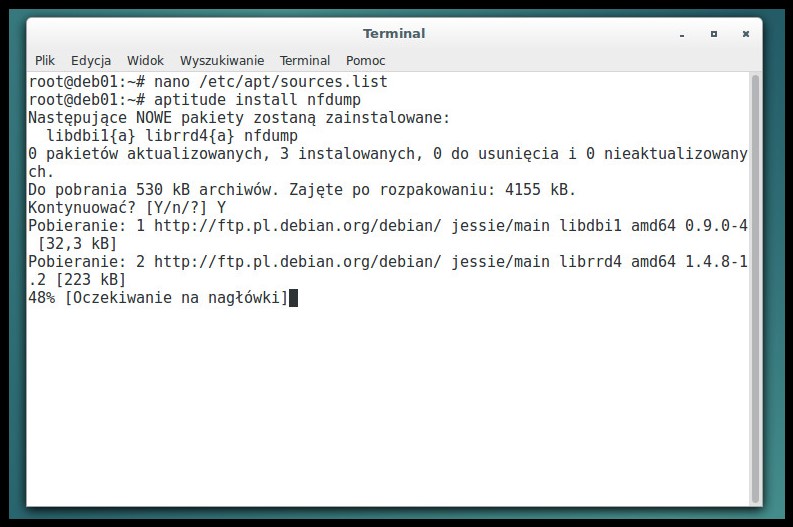
- CLI Installation nfdump packet:
- Run simple flow capture to verify if collector is running and creating output flow statictics files (you can see that i use same tcp port 9995 and folder on my desktop as output destination):

Ok, now it is time to back to vSphere and configure DVS to send network traffic to collector:
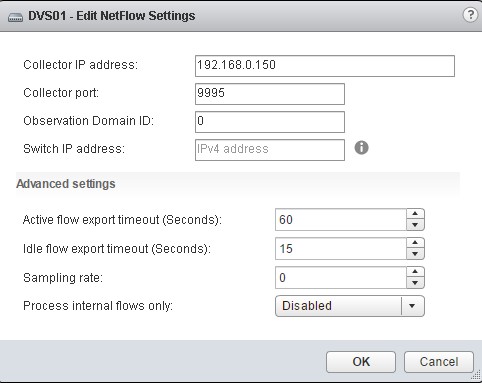
- IP Address: This is the IP of the NetFlow Collector
- Port: This is the port used by the NetFlow Collector.
- Switch IP Address: This one can be confusing – by assigning an IP address of here, the NetFlow Collector will treat the VDS as one single entity. It does not need to be a valid, routable IP, but is merely used as an identifier.
- Active flow export timeout in seconds: The amount of time that must pass before
- the switch fragments the flow and ships it off to the collector.
- Idle flow export timeout in seconds: Similar to the active flow timeout, but for flows
- that have entered an idle state.
- Sampling rate: This determines the interval packet to collect. By default, the value is 0,
- meaning to collect all packets. If you set the value to something other than 0, it will
- collect every X packet.
- Process internal flows only: Enabling ensures that the only flows collected are ones that occur between VMs on the same host.
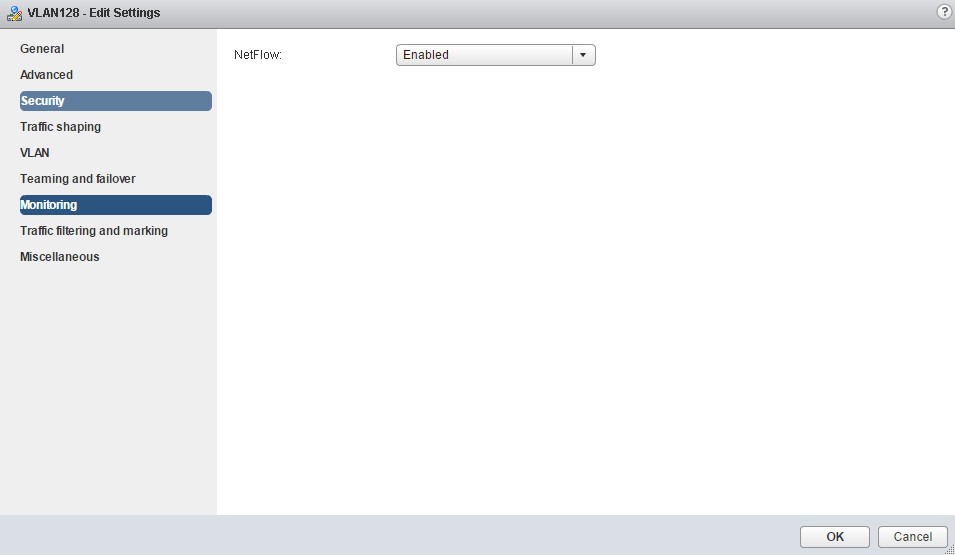
And enable it at designated port group level:
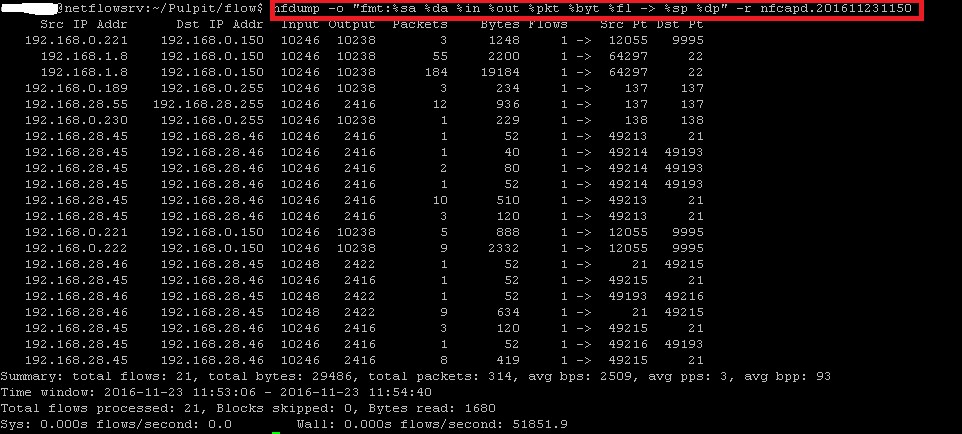
Finally we can create simple lab scenario and capture some ftp flow statistics between two vm’s on different ESXi :
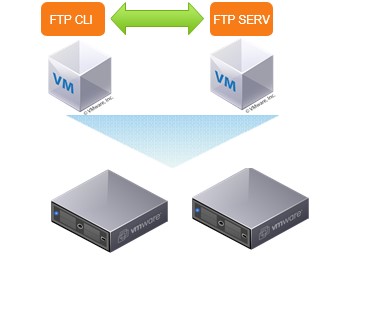
VM’s are running in dedicated vlan on the same DVS port group, collector is running on management network to communicate with vCenter and ESXi hosts. I used ftp connection to generate traffic between vm’s below examples output from two collectors (test ran separate as collector share the same ip) :
ftp client on first vm:
ftp server on second vm:

flow statistics example from netdump:
flow statistics from ManageEngine